Financial News
How Stock Charts Work and How to Use Them to Your Advantage


Price
Volume
Moving Average
Fundamental Metrics
Range And Period
Style
Indicators
Compare
U.S. News & World Report offers stock charts for important U.S. companies. Here’s a breakdown of each chart component:
Price is a key data point. A stock’s current market price shows the last trade price. A stock’s current market price doesn’t reveal its historical price or trending direction. By evaluating a stock chart, investors can see a stock’s past performance and uncover price patterns that could anticipate future price action.
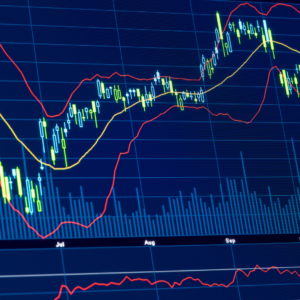
Volume is another basic statistic. Volume is the number of shares traded in a certain period. A daily chart generally includes a bar graph of daily volume. Depending on the stock’s liquidity and price, its volume might range from zero to millions of shares. Large volume spikes can suggest company news, insider or institutional buying, or a change in a stock’s trend or pattern. Volume bars in a stock chart are green on days a stock’s price closed higher and red on days it closed lower.
Moving Average is another essential component of many charts and is commonly included by default. The 50-day SMA is included in the standard U.S. News & World Report stock chart. The SMA represents a stock’s average price over a given period, such as 50 days. Moving averages “smooth out” chart noise so investors can see a stock’s long-term trend.
Fundamental Metrics – Stock charts show investors a stock’s movement and often break down a company’s business. Click “Company Vitals” above any U.S. News stock chart to see these indicators. These include revenue and Earnings Per Share (EPS). EPS is a company’s annual profits divided by its outstanding shares. Price – Earnings (PE) is a stock’s price divided by EPS. Value investors choose stocks with low PEs. Debt-to-equity ratio, operating margin, and enterprise multiple are also important.
Range and period are key in stock chart analysis. Investors can gain dramatically different perspectives on a stock’s past price action by modifying the chart’s range and period.
A stock chart’s period is represented by a single data point. Most charts are daily, but traders can use weekly, monthly, or five-minute timeframes. Its range is the total number of periods included. U.S. News & World Report stock charts offer one-day, one-month, year-to-date, and three-year timeframes.
Style – Chart’s designs vary. Line and area charts are the basics. Line and area charts plot time on the X-axis and stock price on the Y.
Bar and candlestick charts show investors the stock’s opening, closing, and intraperiod high and low values. The “wicks” or “shadows” represent intraperiod highs and lows in a candlestick chart. Vertical lines reflect intraperiod trading range in bar charts. A notch to the left of the line represents the initial price, and a notch to the right represents the closing price.
Technical analysis uses indicators to anticipate future stock movements based on patterns and trends. Advanced price and volume indicators are used to time purchase and sell points. U.S. News charts feature Bollinger Bands’, moving average convergence/divergence, and Relative Strength Index.
Technical analysis and short-term trading are more of an art than a science. These signs aren’t dependable and can be ineffectual.
The U.S. News stock chart’s final element is compare. Many basic charts let users compare many stocks or assets in a single chart. Users can compare a stock to the S&P 500 or the Dow Jones Industrial Average (DJIA). They can also compare a stock’s performance to an ETF like ARK Innovation ETF (ARKK) or Energy Select Sector SPDR Fund (XLE).
You must be logged in to post a comment Login